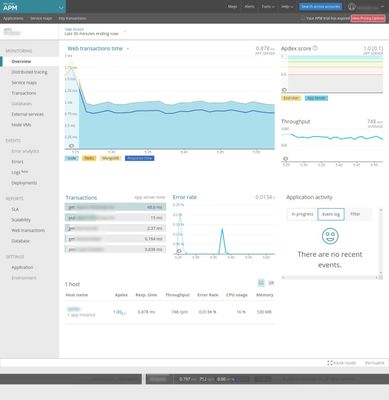
Overview of the application monitoring will tell you more about the overall requests per minute and the response time of a service for each request. You will also find an overview of the top calls and errors for that application. There is also an Apdex score which helps you understand the distribution of requests which are within satisfactory response time range. We noticed that the graphs are rendered via the Highcharts library.